02 / RETAIL · CASE STUDY

Maven Toys
Retail Sales & Inventory

An end-to-end retail analytics case study connecting sales, profitability, product performance, geography, inventory risk and seasonality using BigQuery, GoogleSQL and Looker Studio.
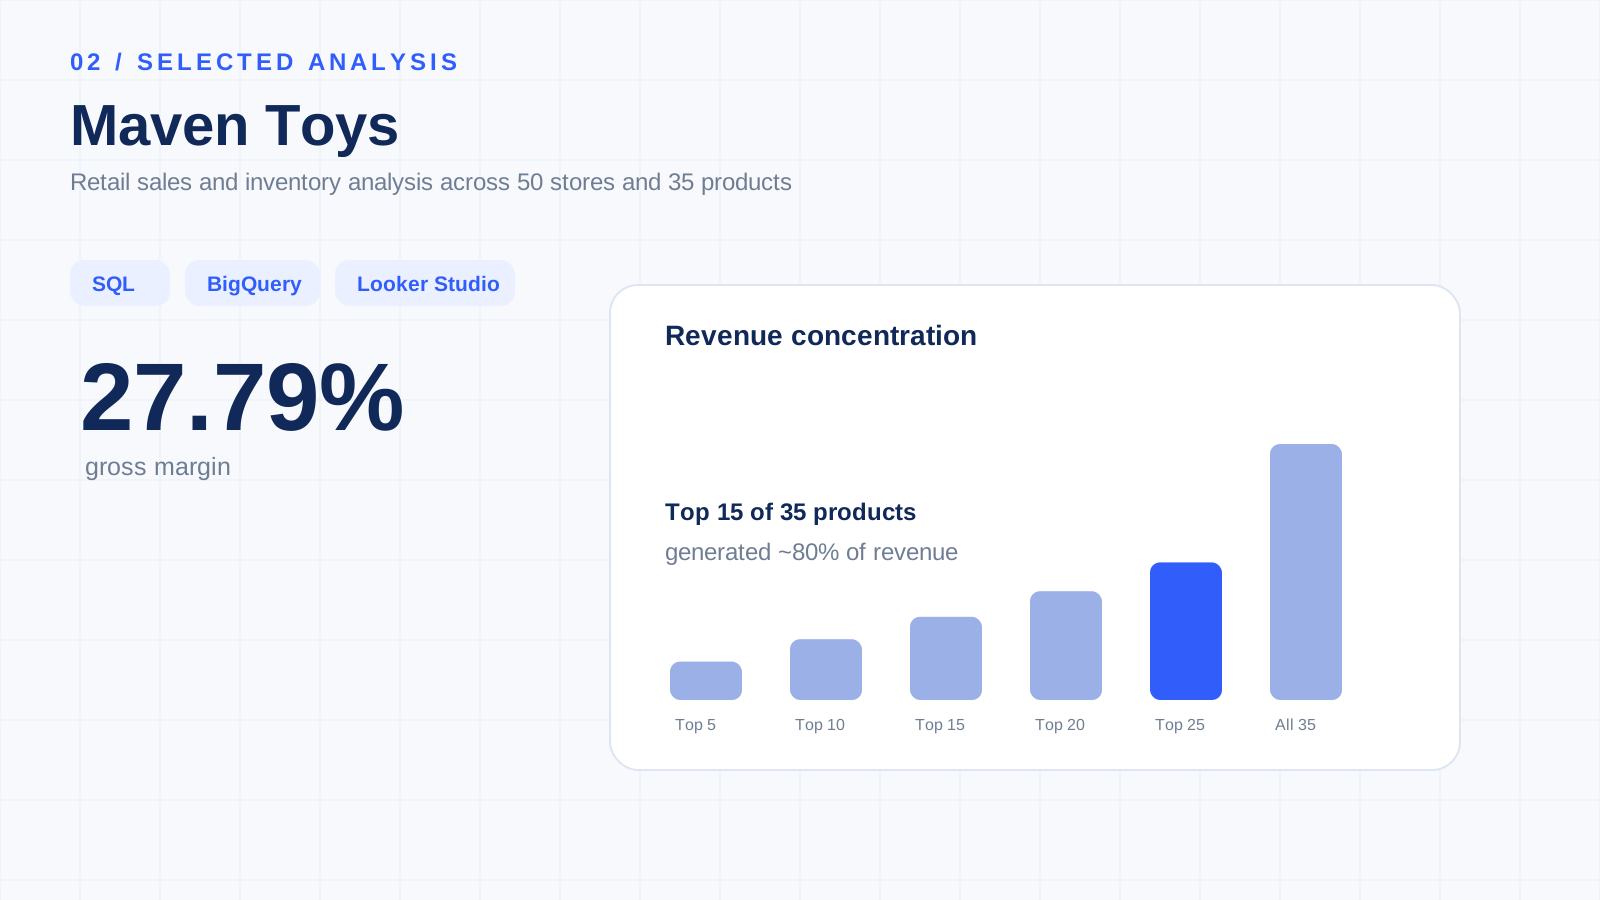
SQLBigQueryLooker StudioInventory Analytics
Maven Toys analytics overview
THE BUSINESS QUESTIONS

Which products, stores and inventory signals deserve attention?

The analysis connects sales performance with product economics, store geography, pricing, inventory coverage and time-based performance.

Which products and categories generate the most revenue and profit?
Which stores and cities contribute most to sales?
Does price relate to sales volume?
Where are current inventory levels potentially insufficient?
DATASET & PERFORMANCE

829K+ transactions across 50 stores and 35 products.

829,262Sales transactions
1.09MUnits sold
$14.44MTotal revenue
27.79%Gross margin
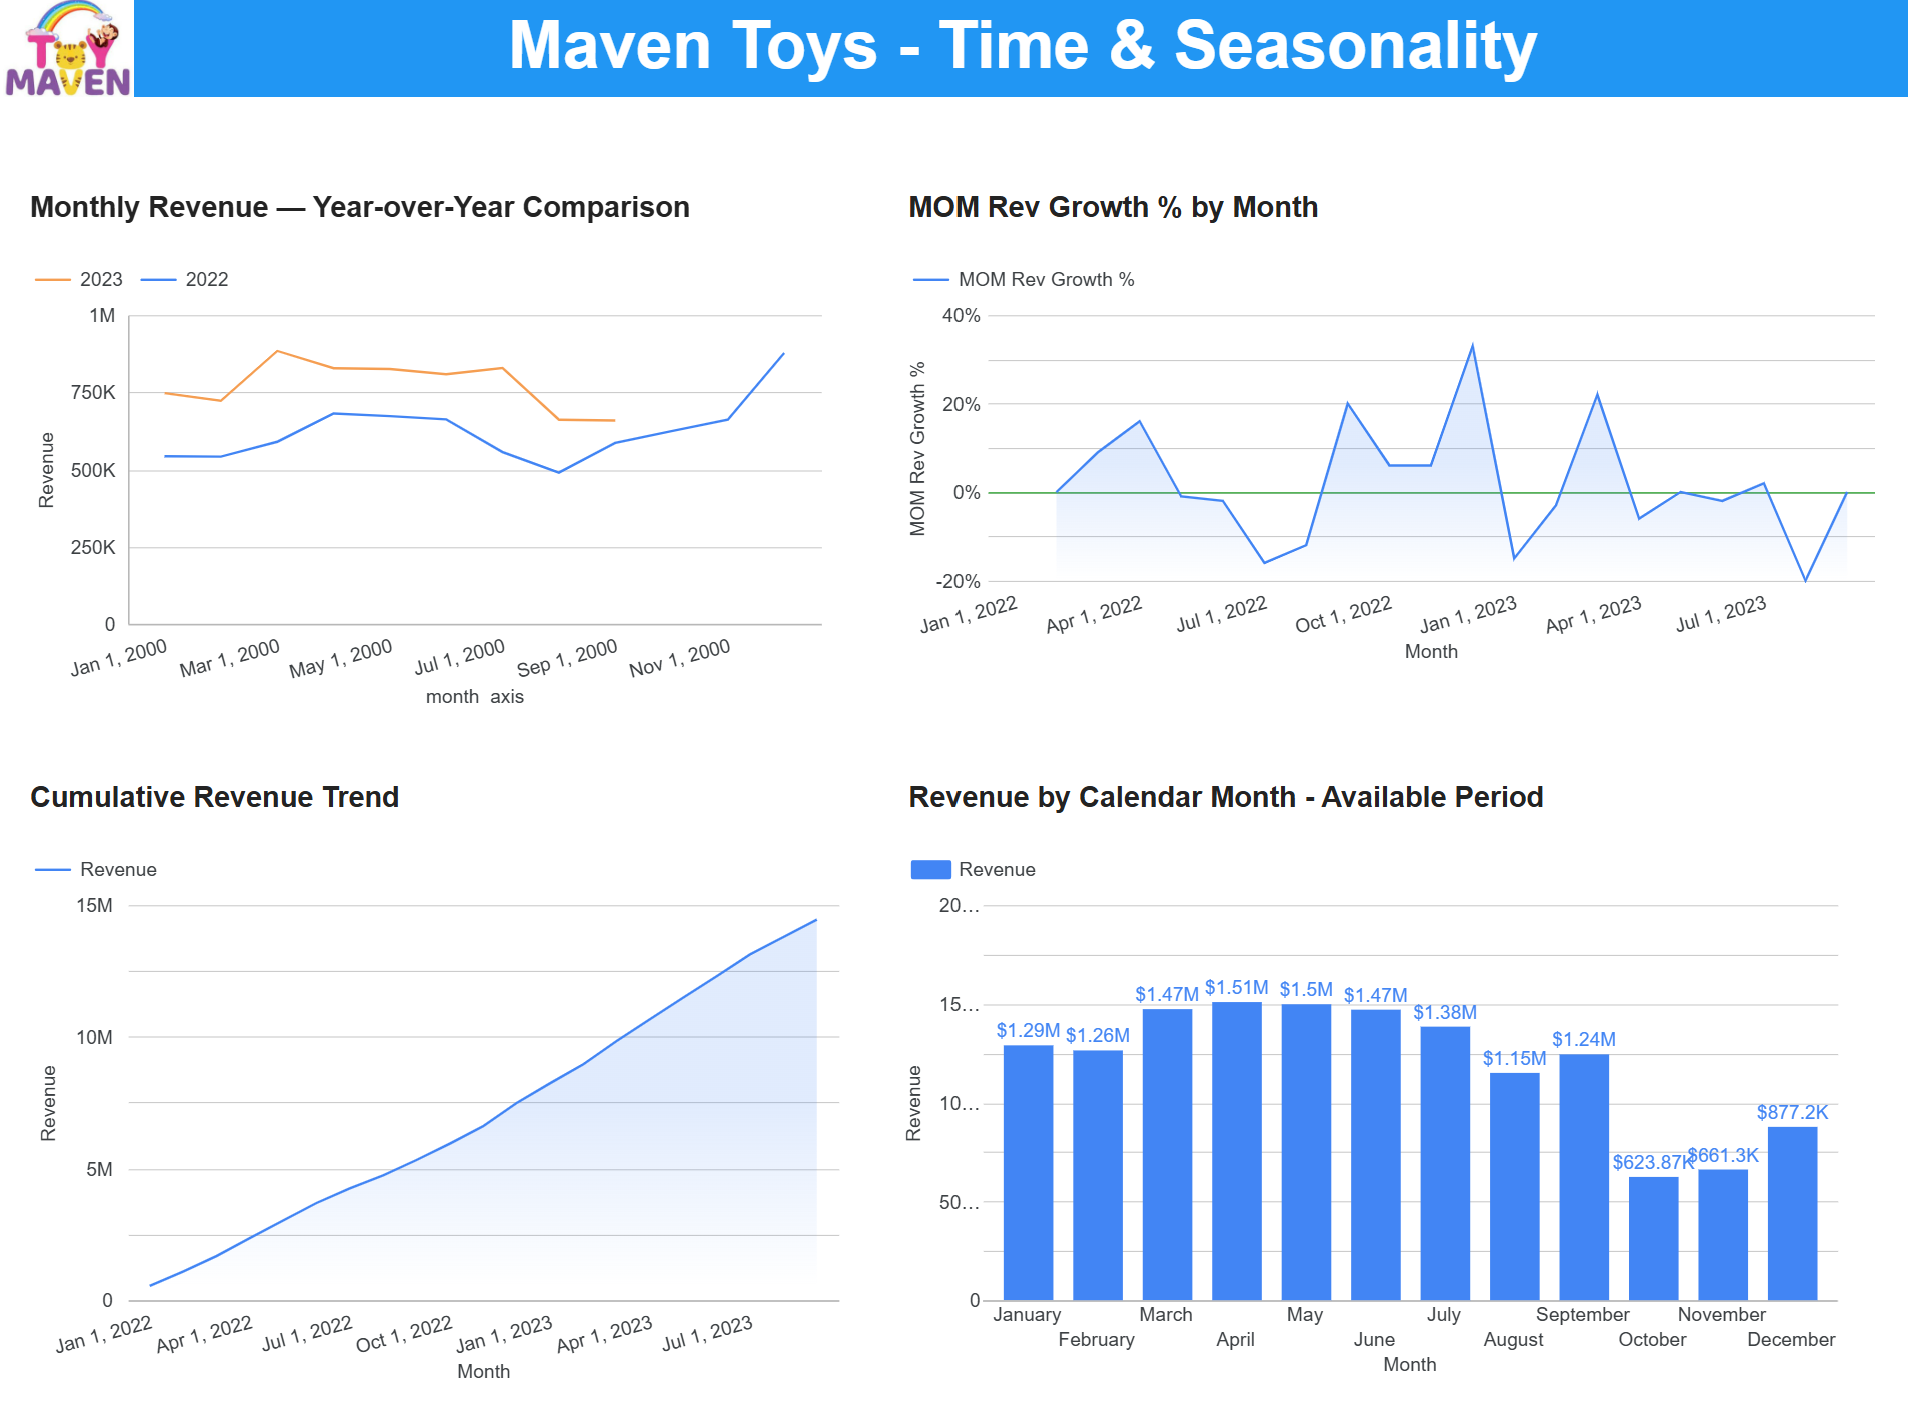
Dataset period1 January 2022 – 30 September 2023 across 638 selling days. Inventory is a current snapshot and is analysed separately from historical sales.
SALES & PROFITABILITY

Revenue leadership and margin leadership are not the same.

Toys is the largest revenue category at $5.09M and 35.26% of revenue, while Electronics has the strongest gross margin at 44.57%.
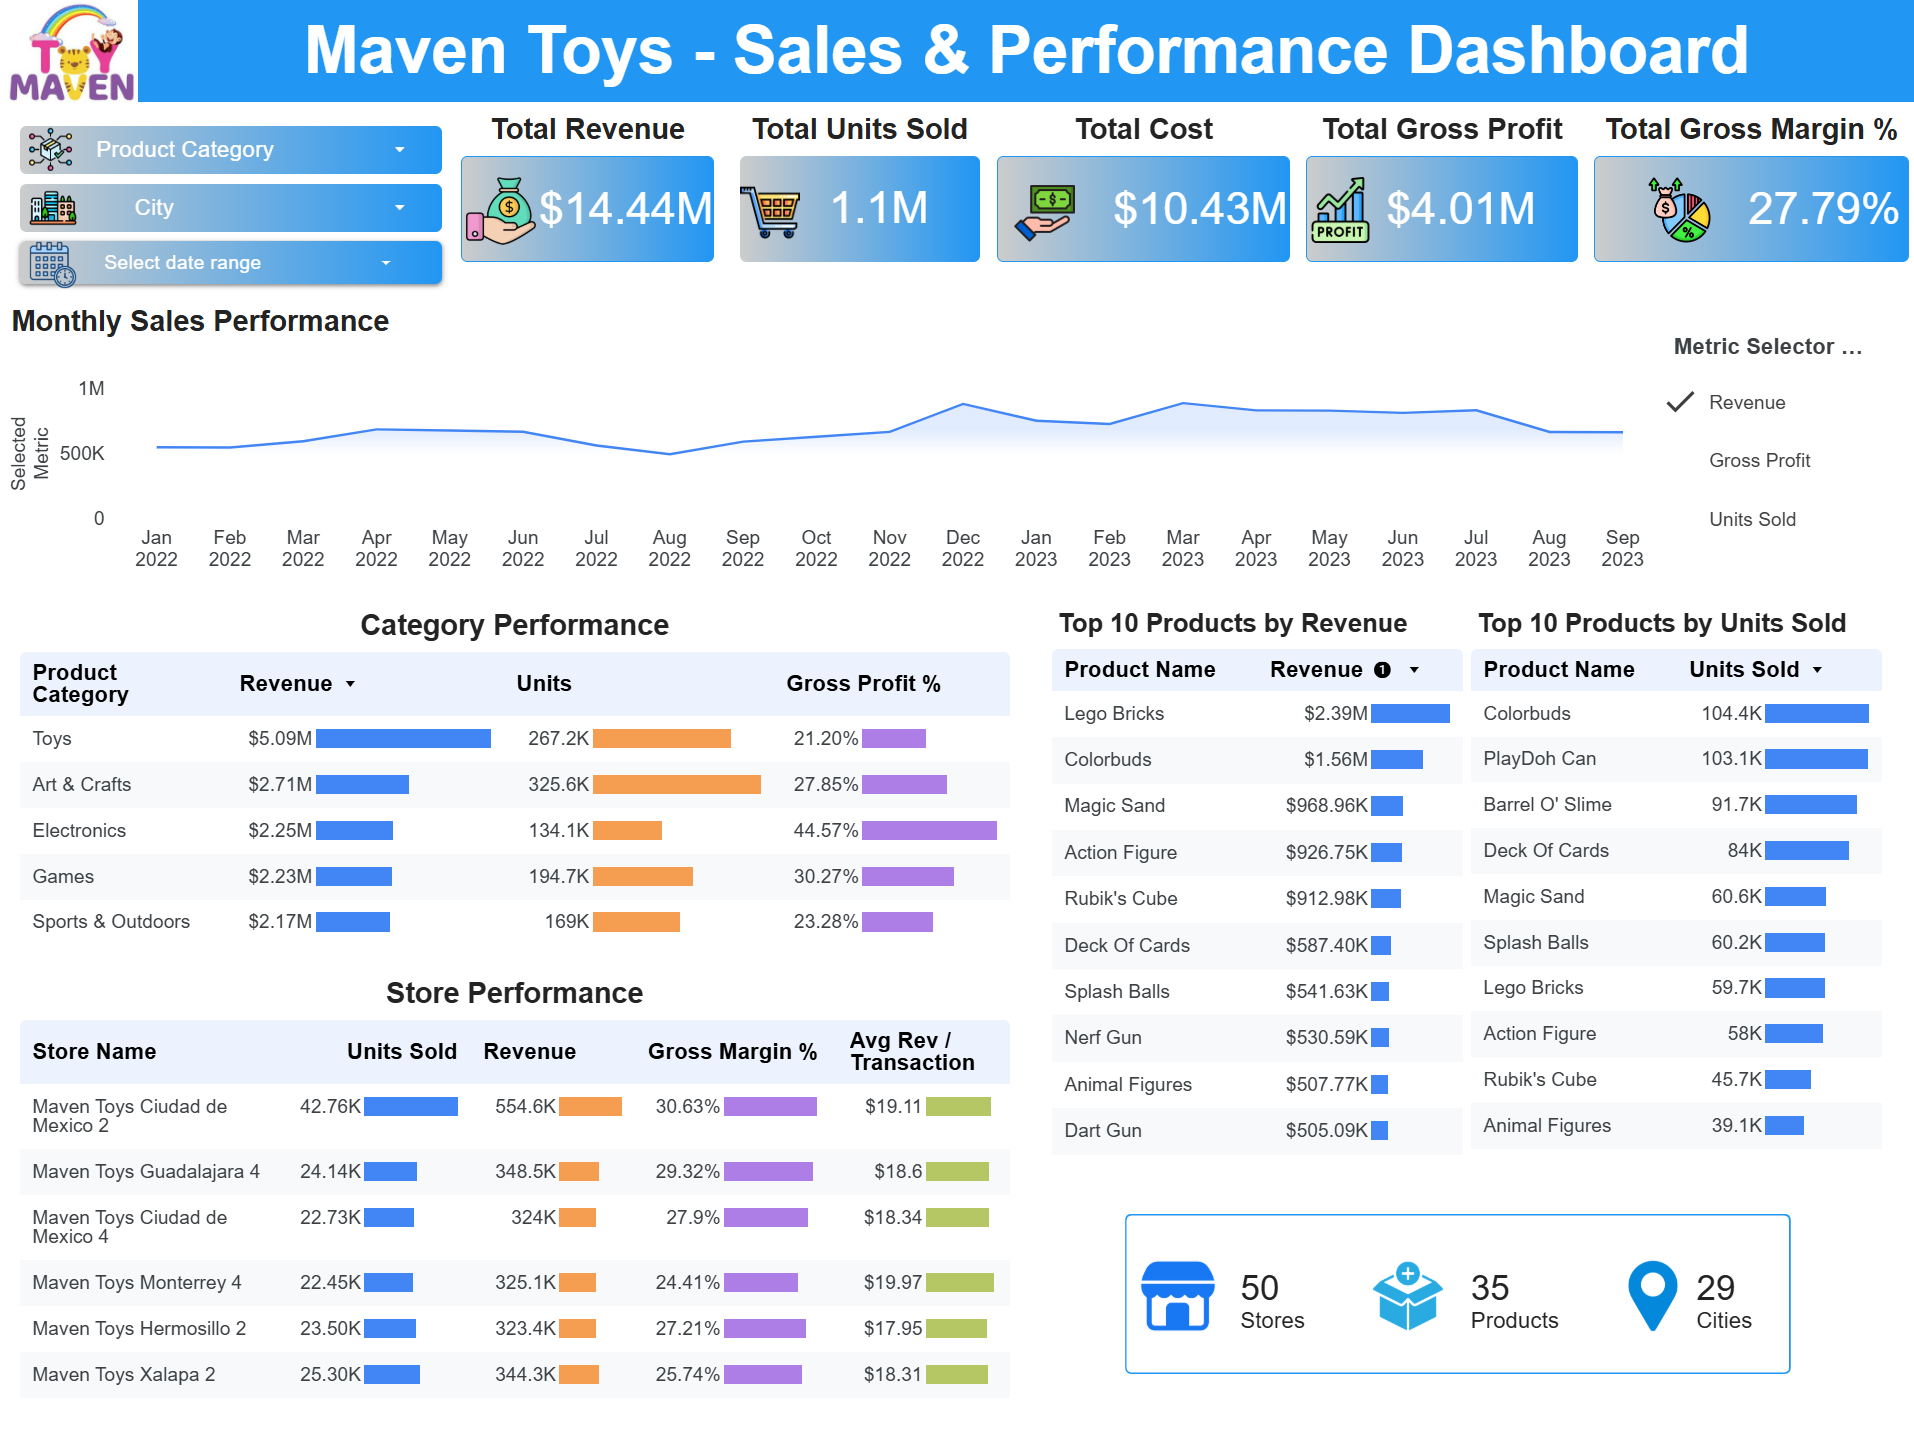
$5.09MToys revenue · 35.26% contributionCategory gross margin: 21.20%
44.57%Electronics gross marginElectronics revenue: $2.25M
Maven Toys Sales Dashboard
Sales & Performance Dashboard
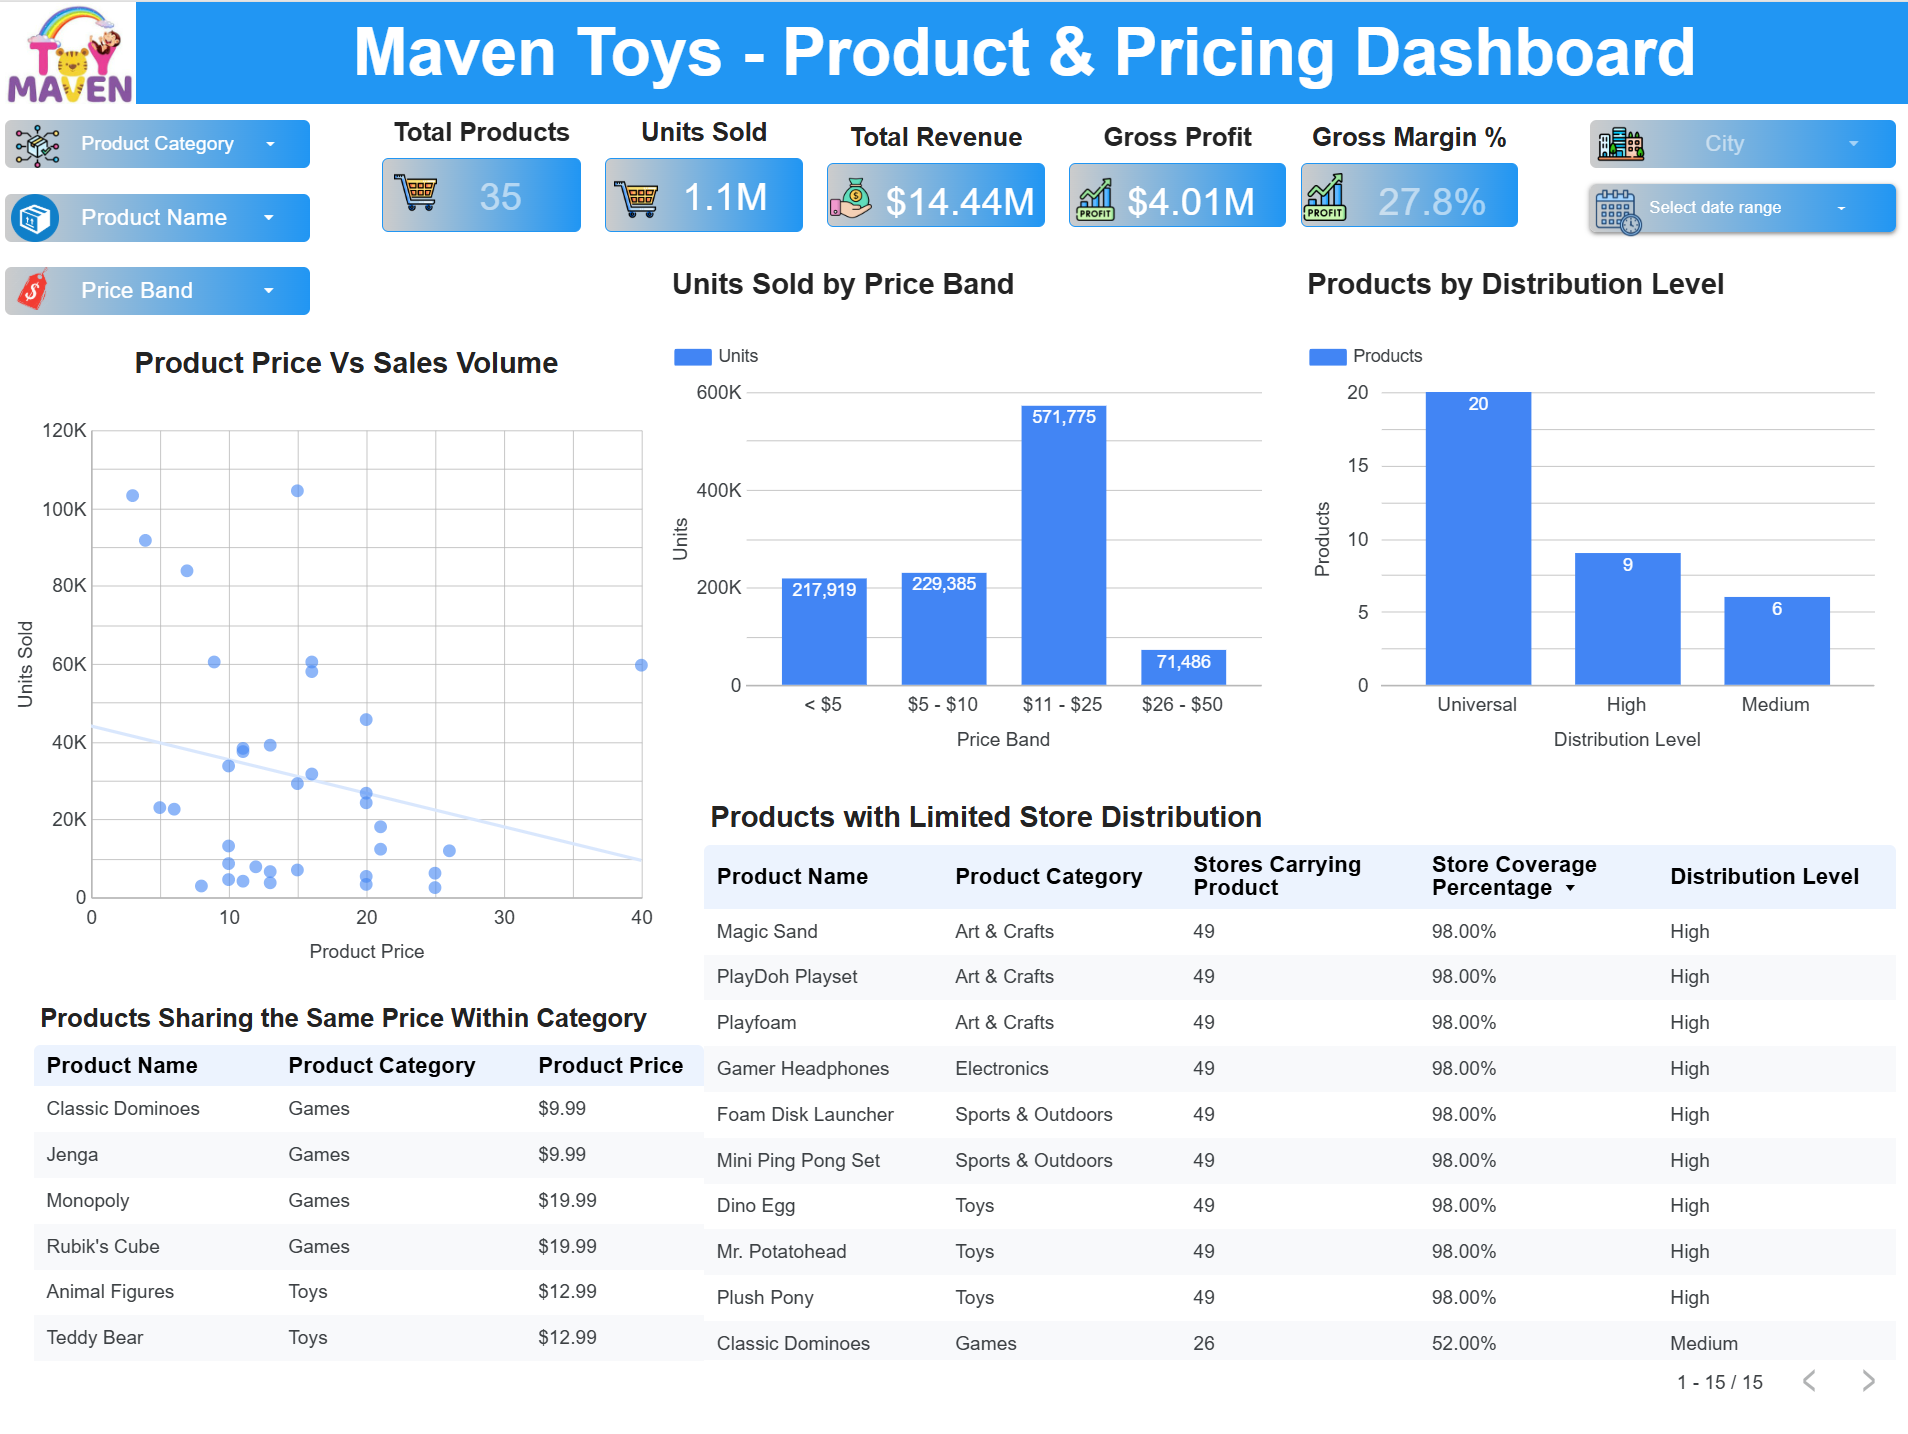
Maven Toys Products and Pricing Dashboard
Products & Pricing Dashboard
PRODUCT CONCENTRATION

15 of 35 products account for ~80% of revenue.

The Pareto analysis identifies a concentrated revenue portfolio. The 80% threshold is crossed at Rank 15 – Gamer Headphones.

KEY INSIGHTApproximately 15 of 35 products generate 80.08% of total revenue.

This provides a practical lens for availability, replenishment, pricing and promotional attention.
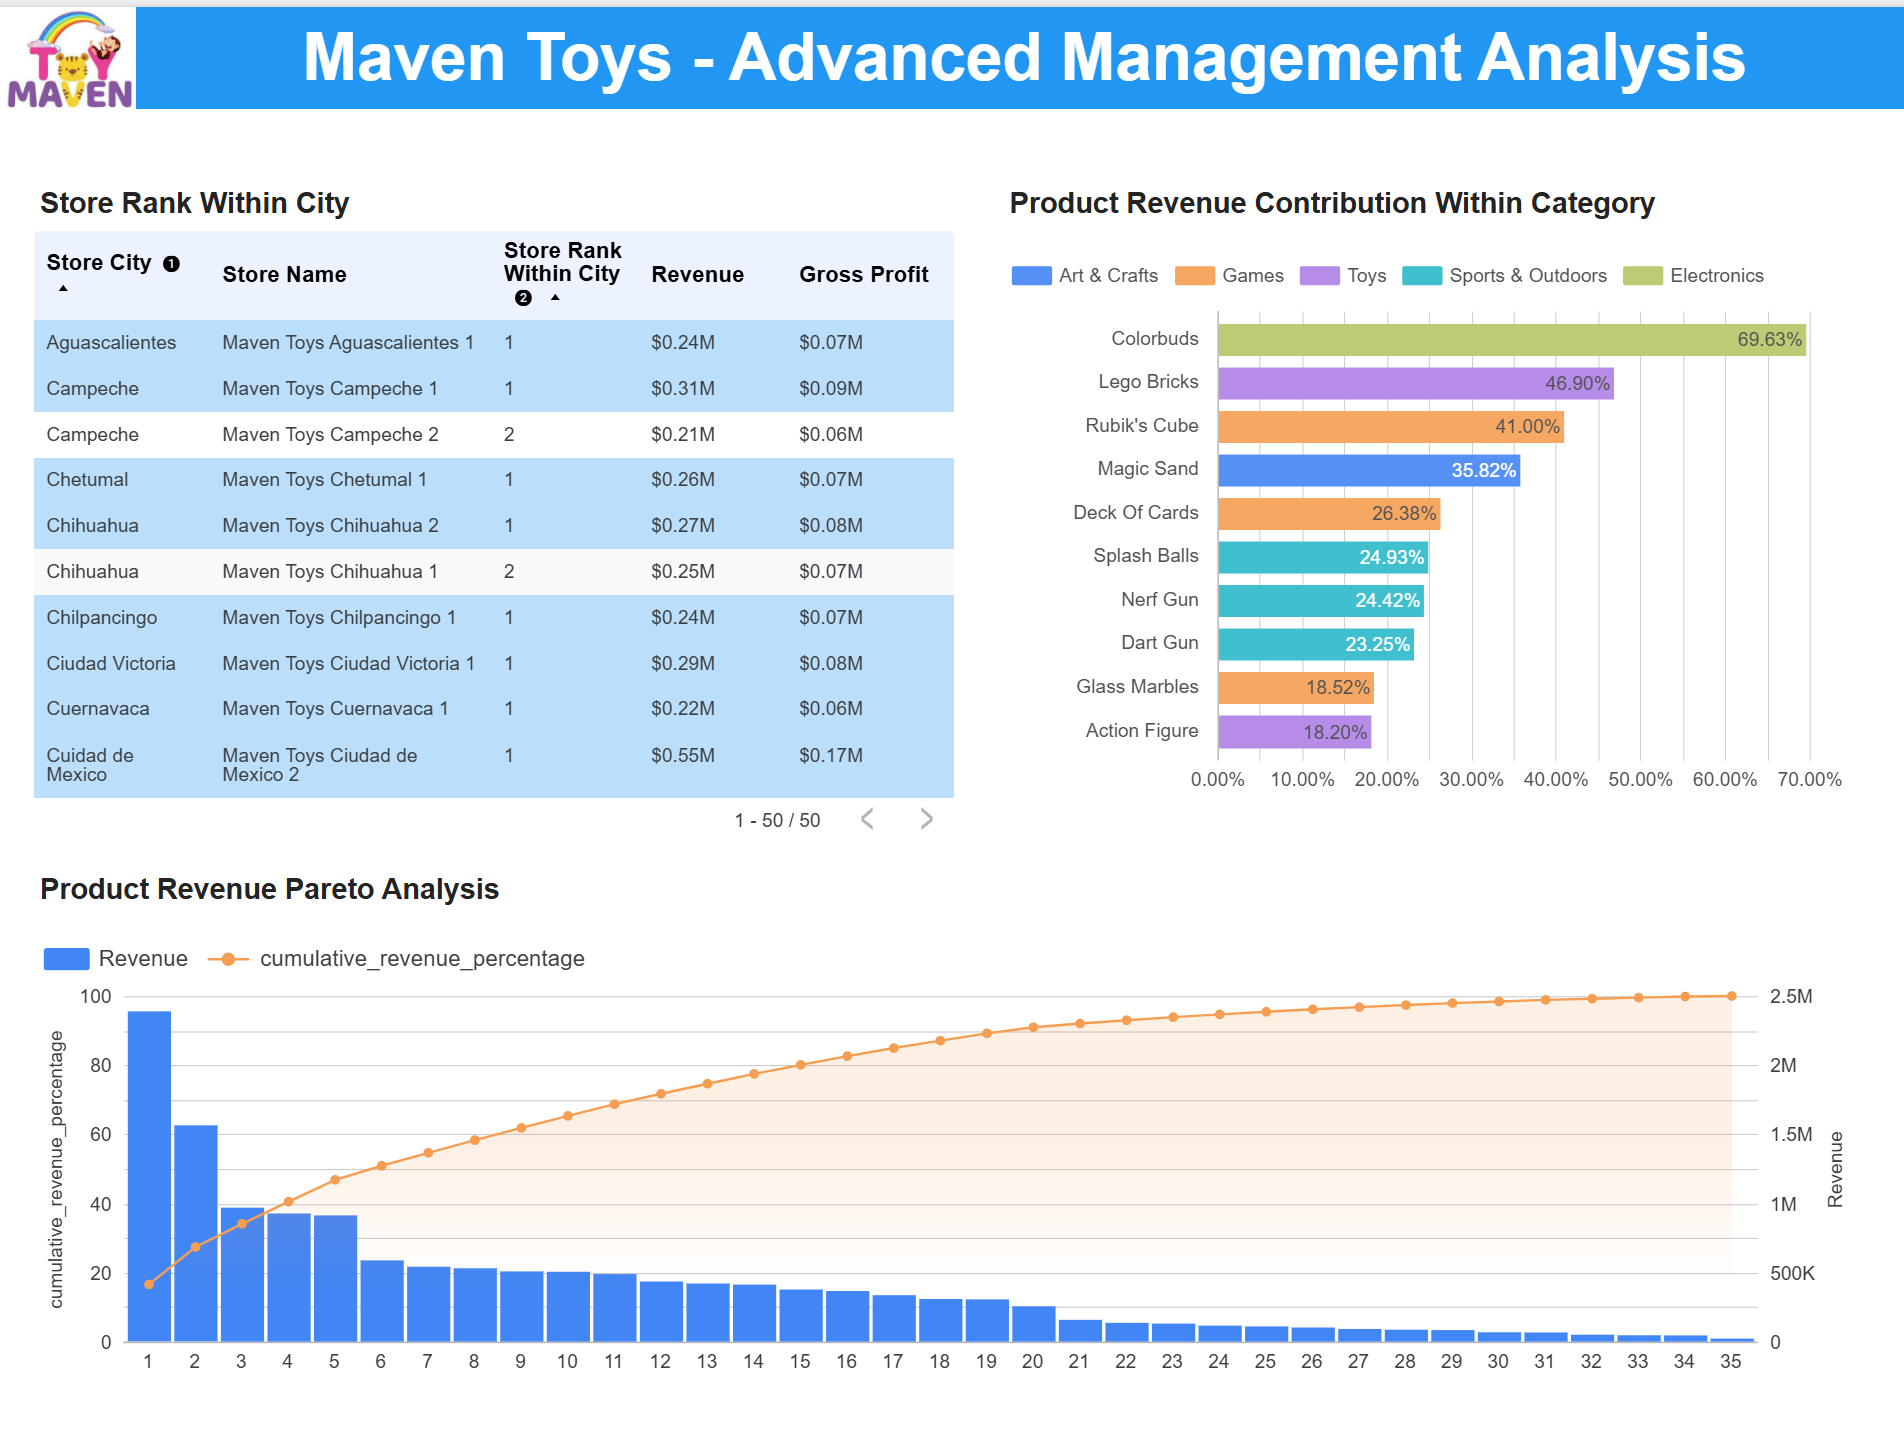
Maven Toys advanced management analysis
Advanced Management Analysis
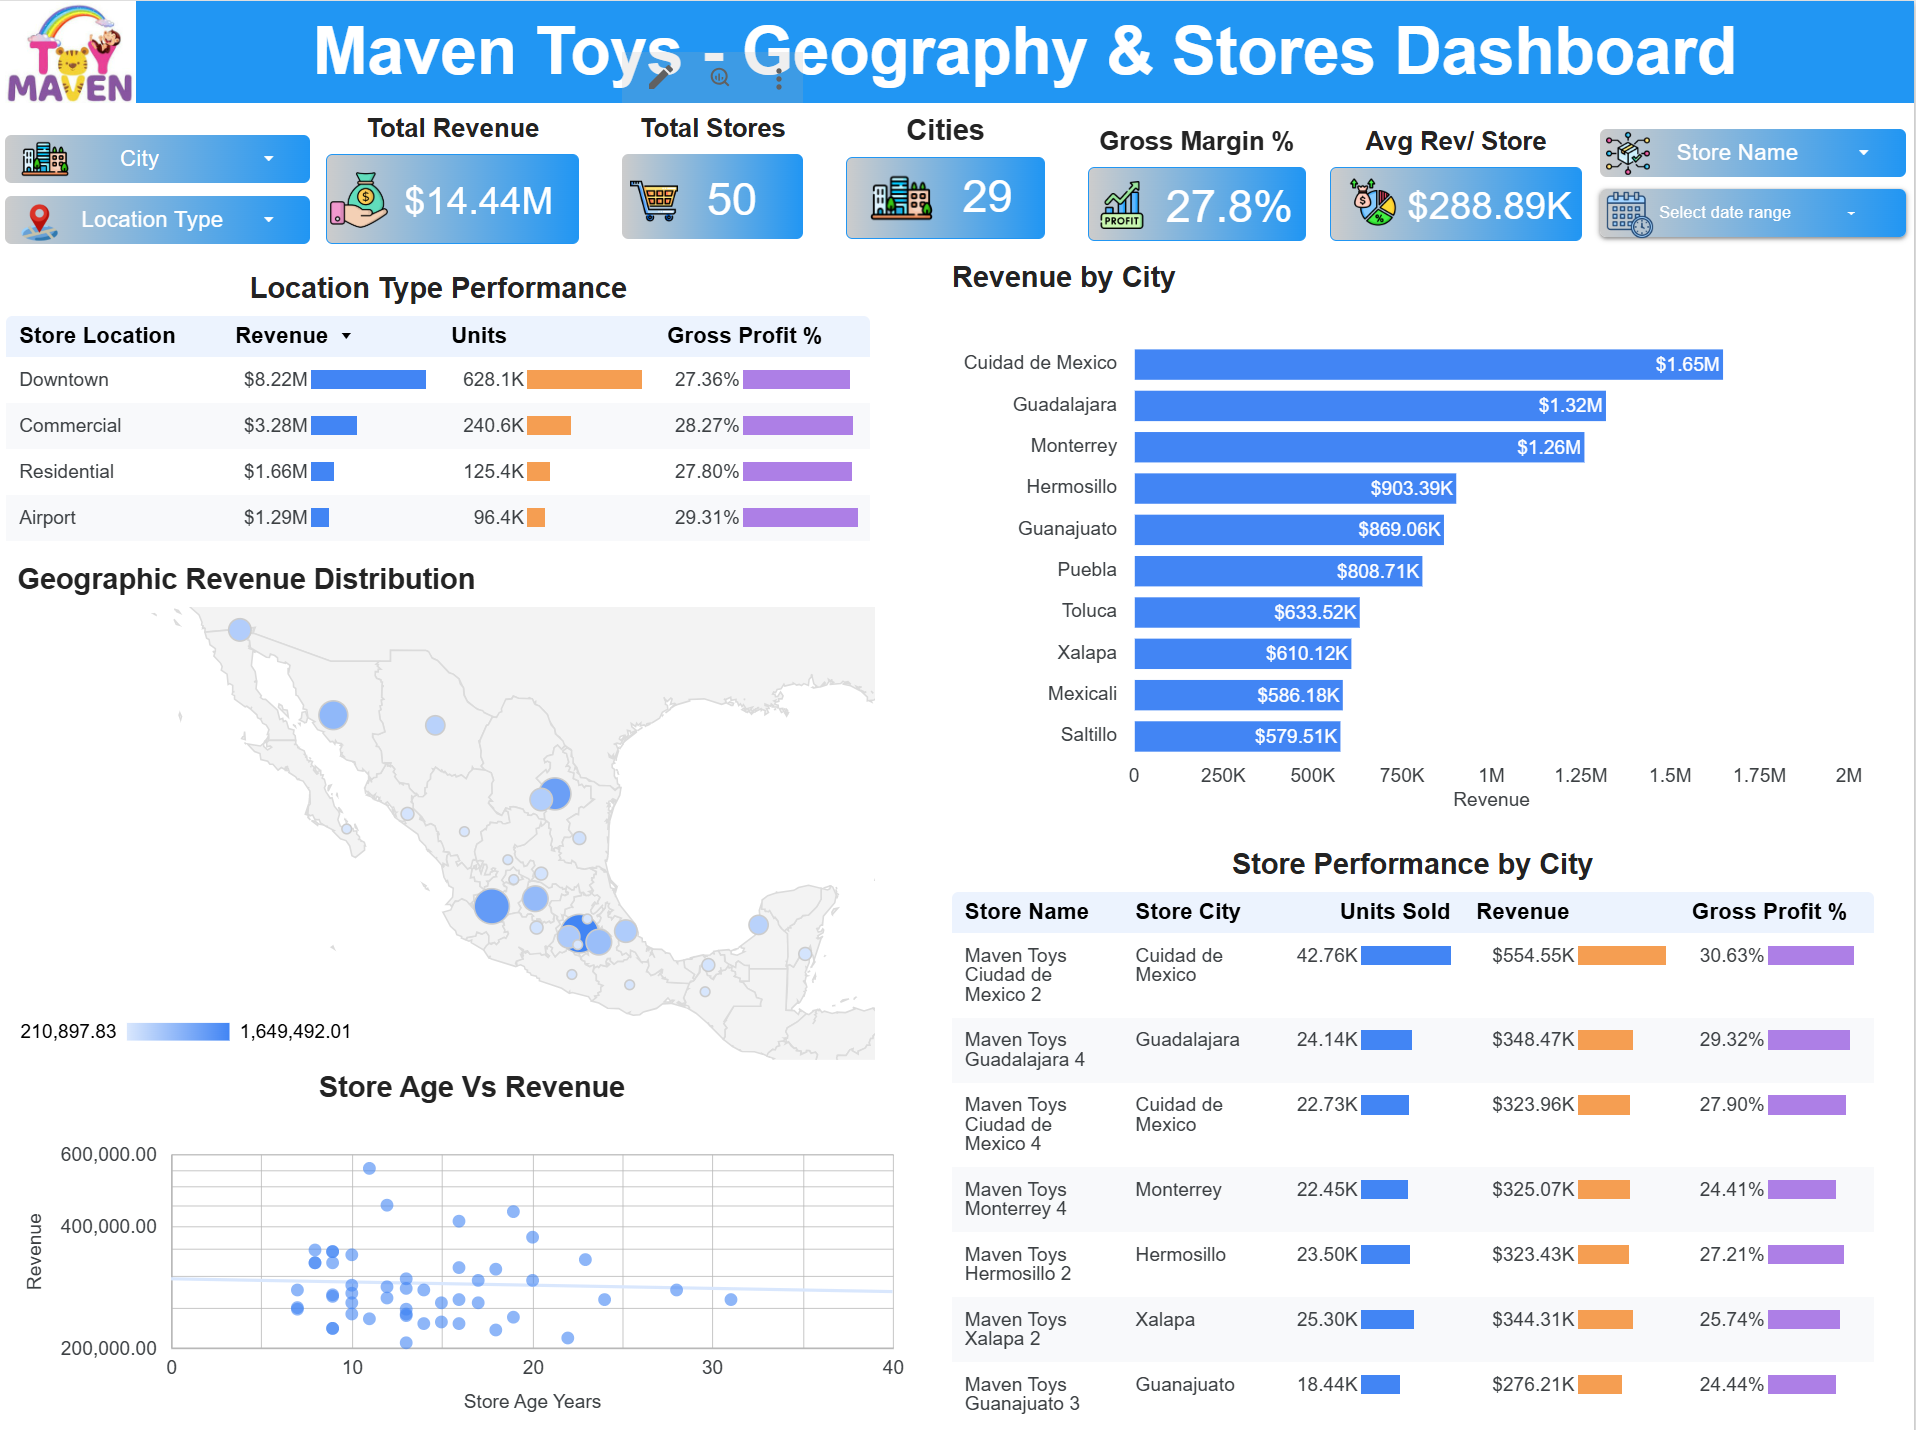
Maven Toys geography and stores dashboard
Geography & Stores Dashboard
INVENTORY RISK

Current stock is evaluated against historical sales velocity.

The project defines inventory indicators for no historical sales, high risk, potential reorder and normal stock. The purpose is to flag potential current risk—not to reconstruct historical stockouts or exact reorder dates.

1,593Inventory records
157Store-product combinations without inventory record
7Duplicate inventory rows
3Records with stock but no historical sales
1,750Possible store-product combinations
35Products represented across at least 25 stores
Important limitationMissing inventory records do not automatically mean zero stock. Inventory risk is an indicator based on historical sales velocity.
GEOGRAPHY & TIME

Performance varies by location and time.

The top five cities—Ciudad de Mexico, Guadalajara, Monterrey, Hermosillo and Guanajuato—contribute approximately 41.58% of company revenue.
41.58%Revenue contribution from the top five citiesCiudad de Mexico leads at $1.65M.
19.67%Revenue growth from August to September 20222023 contains data only through September.
Maven Toys time and seasonality dashboard
Time & Seasonality
ANALYTICAL WORKFLOW

From raw transactions to management insight.

Data Understanding→GoogleSQL→Sales & Product Analysis→Inventory Risk→Looker Studio→Management Insights

Tools

Google BigQuery · GoogleSQL · Looker Studio · GitHub

SQL techniques

CTEs · Aggregations · Window functions · Ranking · Running totals · Percentage contribution · Pareto analysis

Limitations

Inventory is a current snapshot; missing records are not automatically zero stock; price-volume relationships are associations, not causal effects; 2023 data ends in September.